Gatling is an open-source, Scala based load testing tool. It offers a simple proxy based web recorder for following user journeys, or alternatively you can codify the user journey via Gatling’s Scala based DSL.
Gatling
With BBC moving most of its infrastructure to AWS, each product team needs to ensure its stack is stable. News has started to load test its own components with consultation from our internal load test team, rather than ask the team to do it. Within my team, BBC News, we have recently moved to Gatling from Apache Jmeter; so far we have found Gatling to suite our needs better than Jmeter.
We made this move because we wanted to get real time metrics from our EC2 instance that we run Jmeter on. One of the common ways to store metrics is by using the Graphite protocol. Graphite offers a web interface, database and REST API. While a Graphite listener is in the master branch of Jmeter, it are not released, so at some point Jmeter will be offering this feature. For now though, Gatling offers us this and much more, as well as being consistent with our load test team.
In order to ensure that Gatling was the right choice for us, I needed to explore the benefits of real time metrics and see what we would need to setup to record these results. This meant choosing a front end dashboard and backend datastore that were compatible with Gatling, as well as not creating too much maintenance overhead. The rest of the post will explain my choices and how Docker impacted them.
Storing the Data
The standard way of recording metrics in Gatling is by using the Graphite metrics protocol. You must start the database and web service separately by running Python files. On some OS’s such as Ubuntu, there are pre-configured packages, these aren’t available on CentOS though, which is the distribution we use. Because of this, we decided to go with InfluxDB, which accepts the Graphite protocol.
InfluxDB is a time series database with a admin interface and a REST API all in one Go binary. Pretty neat compared to the pain of setting up Graphite.
View Metrics in Grafana
Once InfluxDB was our database of choice, there was really only one option for the frontend dashboard, Grafana. This dashboard has become something of a standard for people looking to visualise metrics, it is very customisable and works with Graphite, InfluxDB and OpenTSB.
Docker?
Now we have our technology choices, we need to get up and running. Before I propose a lot of potential tasks to my team, we need to make sure it offers us benefits and fits our needs, so we need to do a few things. Install python, get source code for both InfluxDB and Grafana, setup the databases, configure the InfluxDB backend and setup the Grafana front end. Docker offered me a simple way to get this all running with no impact to my dev machine and make it easy to share with others so they can try it out.
With the metrics offering in place, we can now get Gatling feeding in data, once I saw that first stream of data, I am once again reminded how simple Docker makes exploring new technology options.
Running InfluxDB and Grafana
All the Dockerfiles and configs for this setup are available on Github
To setup and run the stack, run the start script, ./start, this will download the images from the registry and run them. Visit localhost:8081 or your boot2dockerIP http://192.168.59.103:8081/ and you’re all setup with your metric system.
InfluxDB
All the options for InfluxDB are the influxdb directory, but the web interface is located at localhost:8083 or your boot2dockerIP and port e.g http://192.168.59.103:8083/
Login using root:root and click the database tab to view the gatling data. Once here, you can type list series to view all data in the database. InfluxDB uses a SQLish query language, so queries are straight forward once you know the data format.
Feeding Data in from Gatling
I have included a sample gatling.conf in the repo which is mostly the vanilla conf except for writers section under the data block, as well as the graphite options. InfluxDB accepts data using the Graphite protocol, so by using these options, data will still go into the database as if it were Whisper database used by Graphite.
Once you have your load test running, you should data like this :
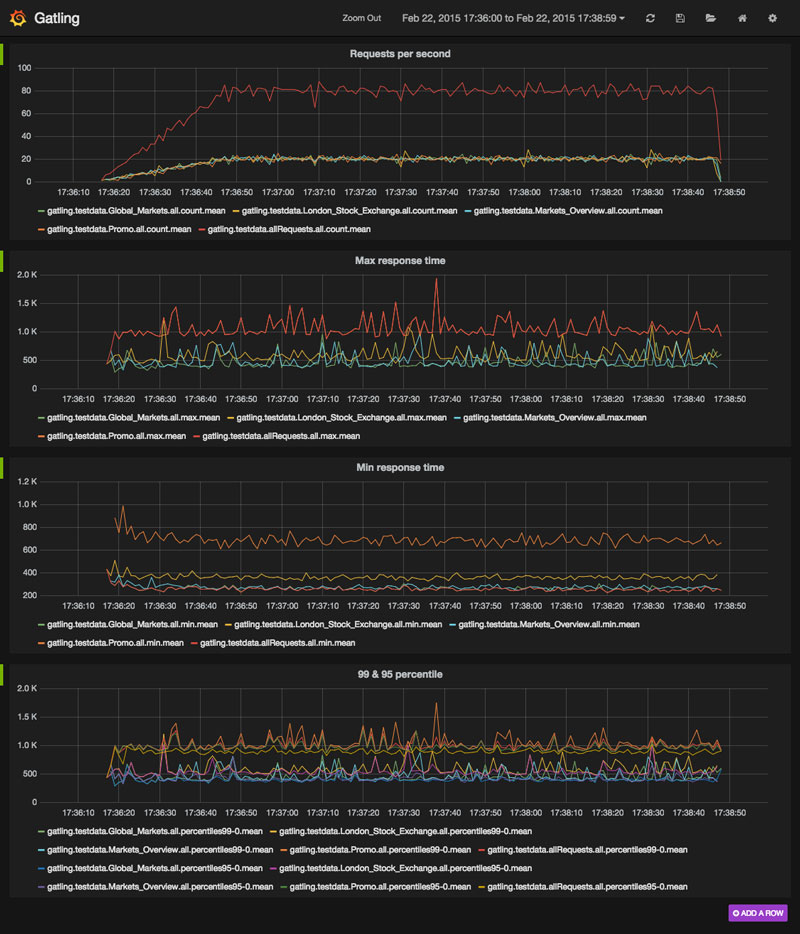
I have created a basic dashboard, but it gives some of the key data from the load test.
Making the Choice
When making a technology choice, it can be easy to lose faith in the choice because the setup is so hard, especially when you may only want to try something for a few short period of time. Together, Docker, InfluxDB and Grafana made the choice of using Gatling more about the capabilities and features and less about how quickly we can setup things up or get things working.